 |
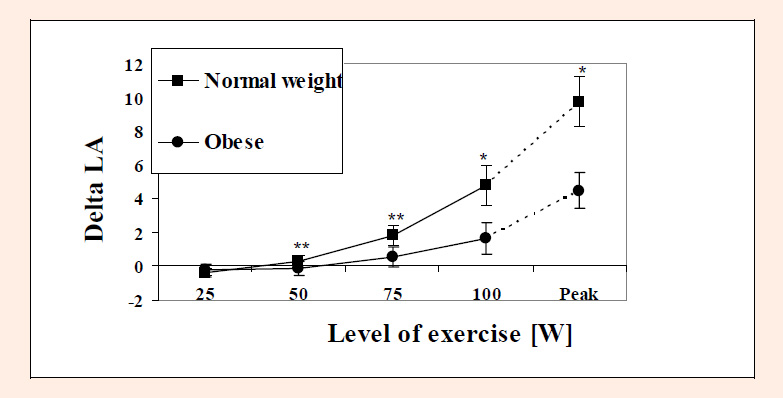
Figure 2.
Difference between lactate concentration at each level during the test and resting value in obese and normal weight women. * p < 0.05; ** p < 0.01; *** p < 0.001.
|
|
|
Figure 2.
Difference between lactate concentration at each level during the test and resting value in obese and normal weight women. * p < 0.05; ** p < 0.01; *** p < 0.001.
|