 |
Figure 3.
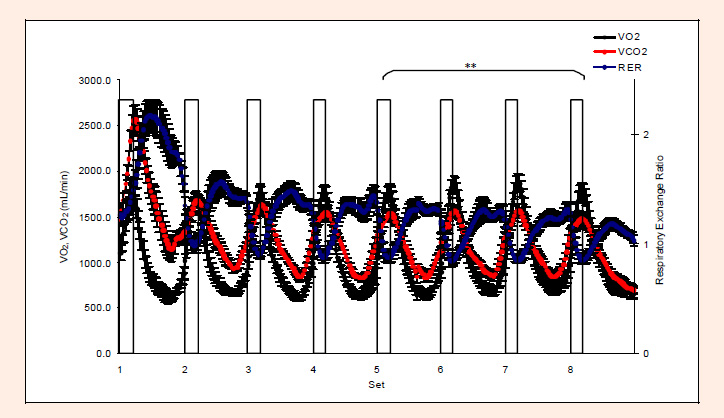
Average VO, VCO and RER during the exercise session. Vertical bars show exercise periods. Values are means ± SE. (N=9), 0.01 from the first four sets (RER).
|
|
|
Figure 3.
Average VO, VCO and RER during the exercise session. Vertical bars show exercise periods. Values are means ± SE. (N=9), 0.01 from the first four sets (RER).
|