 |
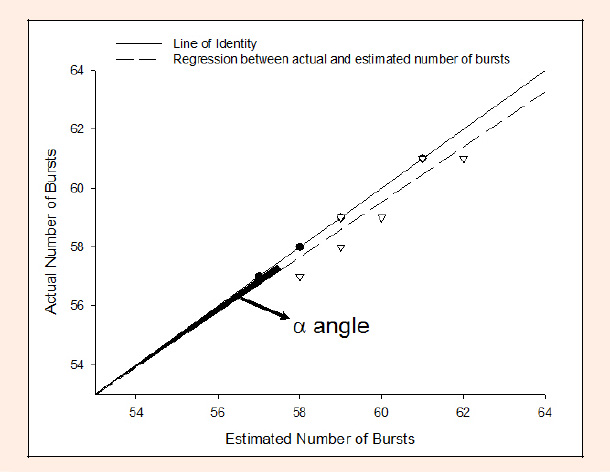
Figure 2.
Representation of the line of identity and the regression line between actual and estimated number of bursts with a selected threshold value. The angular difference between the two lines was defined as .
|
|
|
Figure 2.
Representation of the line of identity and the regression line between actual and estimated number of bursts with a selected threshold value. The angular difference between the two lines was defined as .
|