 |
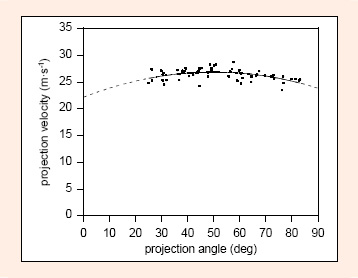
Figure 3.
Projection velocity as a function of projection angle for a male soccer player. The fitted curve is from . Data for Participant 1, = 0.51. The projection angle remained almost constant across all projection angles and so had little influence on the player’s optimum projection angle.