 |
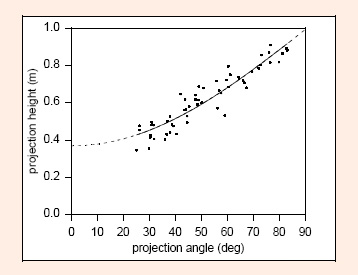
Figure 4.
Projection height as a function of projection angle for a male soccer player. The fitted curve is from . Data for Participant 1, = 0.94. The projection height increased with increasing projection angle, but this had little influence on the player’s optimum projection angle.