 |
Figure 3.
Time-transient profiles of kicking velocities for the four different kicks. The thick line shows kicking velocity profiles averaged across all subjects. The shaded area indicates the standard deviation.
|
|
|
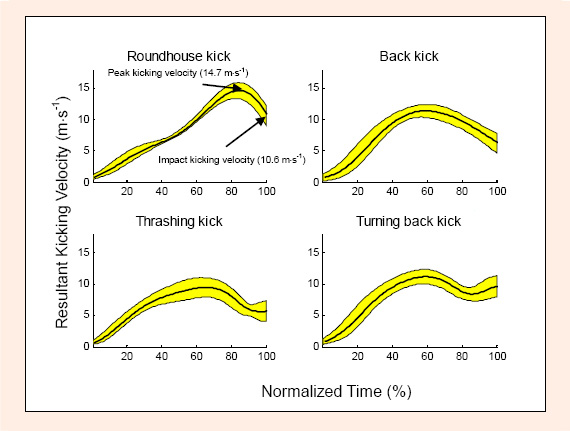
Figure 3.
Time-transient profiles of kicking velocities for the four different kicks. The thick line shows kicking velocity profiles averaged across all subjects. The shaded area indicates the standard deviation.
|