 |
Figure 2.
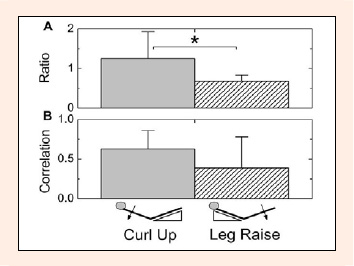
Mean and standard deviation of the ratio between the root-mean square (RMS) values (A) and of the cross-correlation value (B) of the upper and lower portions EMG data during the Curl Up and Leg Raise tasks (* p = 0.02).
|
|
|
Figure 2.
Mean and standard deviation of the ratio between the root-mean square (RMS) values (A) and of the cross-correlation value (B) of the upper and lower portions EMG data during the Curl Up and Leg Raise tasks (* p = 0.02).
|