 |
Figure 1.
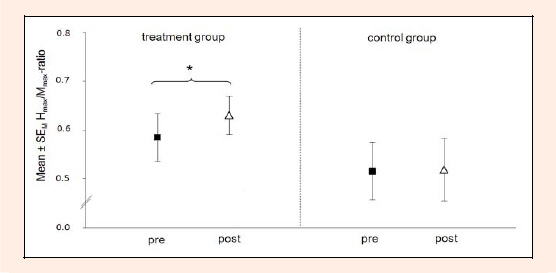
Group mean ± standard error of the mean from pre- and post-measurement of all subjects of the treatment (TG) and control group (CG) are displayed. Following RPMS, the H/M-ratios of TG were significantly increased
|
|
|
Figure 1.
Group mean ± standard error of the mean from pre- and post-measurement of all subjects of the treatment (TG) and control group (CG) are displayed. Following RPMS, the H/M-ratios of TG were significantly increased
|