 |
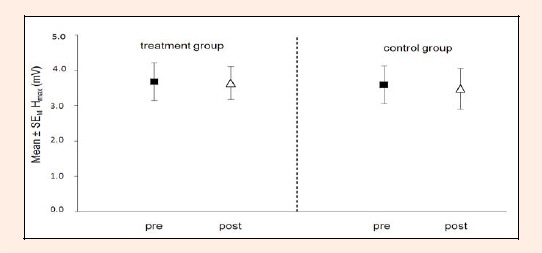
Figure 2.
Group mean ± standard error of the mean of peak-to-peak SOL H-reflex from pre- and post-measurement of all subjects of the treatment (TG) and control group (CG) are displayed. Following RPMS H of TG revealed no significant difference