 |
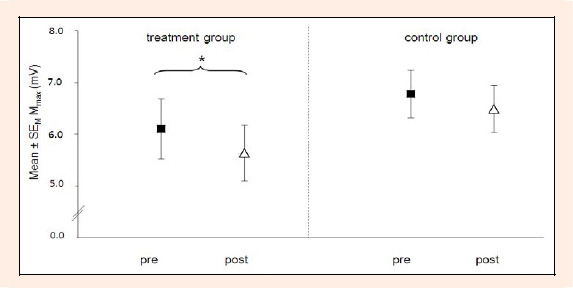
Figure 3.
Group mean ± standard error of the mean of peak-to-peak SOL M from pre- and post-measurement of all subjects of the treatment (TG) and control group (CG) are displayed. Following RPMS maximal M wave of TG was significantly decreased