 |
Figure 1.
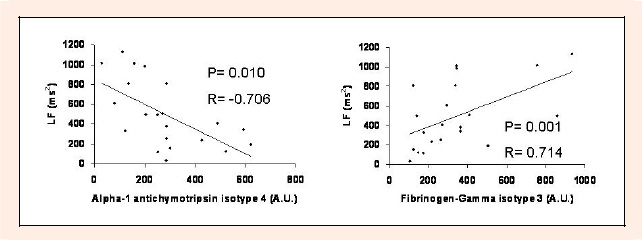
Scatter plots showing the relationship between low frequency and the plasma levels of fibrinogen-gamma isotype 3 and alpha-1 antichymotrypsin isotype 4. A.U.: densitometric arbitrary units
|
|
|
Figure 1.
Scatter plots showing the relationship between low frequency and the plasma levels of fibrinogen-gamma isotype 3 and alpha-1 antichymotrypsin isotype 4. A.U.: densitometric arbitrary units
|