 |
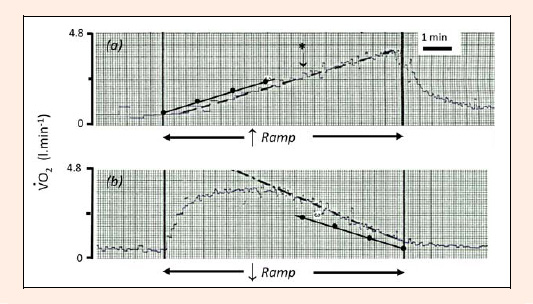
Figure 2.
Breath-by-breath VO responses as a function of time in a representative subject for (a) incremental-ramp exercise ( Ramp; 30 W.min) and (b) maximal decremental-ramp exercise (Ramp; 30 W·min). Asterisk represents θ¸. Solid circles represent steady-state responses, with line of best fit (solid line). Lines of best fit to the linear regions of the incremental and decremental ramp responses are shown as dashed lines.