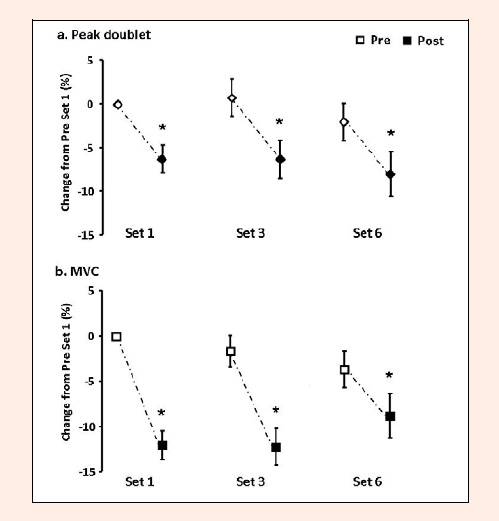
Figure 2.
* Significantly different from pre S1 values (p < 0.05).