 |
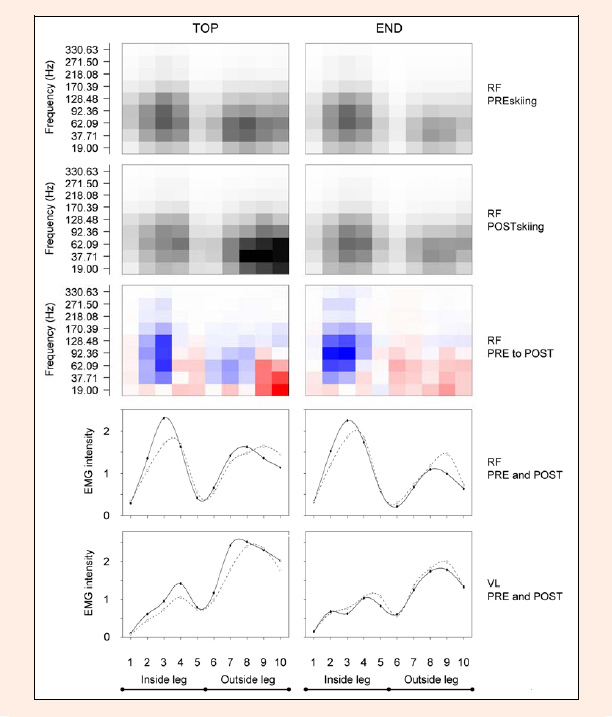
Figure 5.
Alterations in timing aspects from PREskiing to POSTskiing of m. rectus femoris (RF) and m. vastus lateralis (VL). Left column of diagrams represent results for TOP of the run while right column represent END of the run. From top to bottom: PREskiing grid plot for RF, POSTskiing grid plot for RF (high intensities = dark shading); shift from PRE to POST for RF (blue = decrease, white = unchanged, red = increase); course of total EMG intensity for RF, course of total EMG intensity for VL (PREskiing = solid, POSTskiing = dashed)