 |
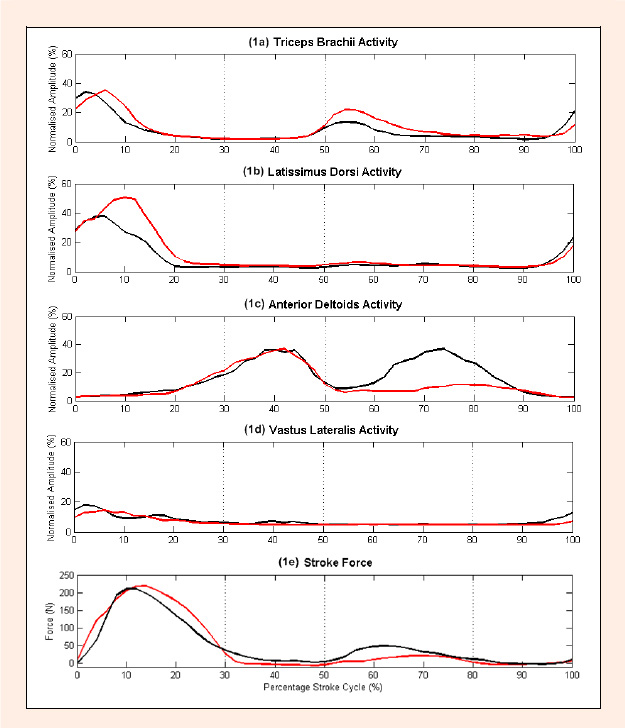
Figure 1.
Group mean ensemble EMG traces (1a to 1d) and group mean stroke force profiles (1e) recorded during on-water (red) and on-ergometer (black) kayaking. The dashed vertical lines separate the approximate phases of the stroke cycle; draw phase (0-30%), transition phase (30-50%), opposite draw phase (50-80%) and opposite transition phase (80-100%).