 |
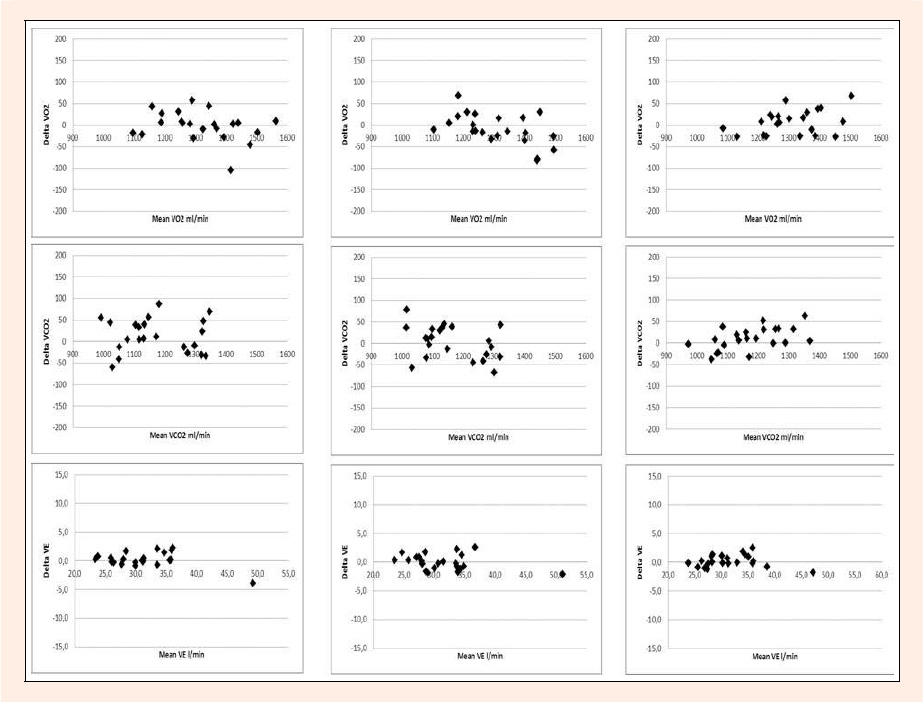
Figure 1.
Bland and Altman plots for oxygen uptake (VO2), carbon dioxide production (VCO2) and minute ventilation (VE) for Mobile Oxycon 1 (M1), Mobile Oxycon 2 (M2) and the Oxycon Pro (Pro). All data points represent single measurements collected during cycling at 100 Watts. X-axis: mean of two measurements. Y-axis: difference between two measurements.