 |
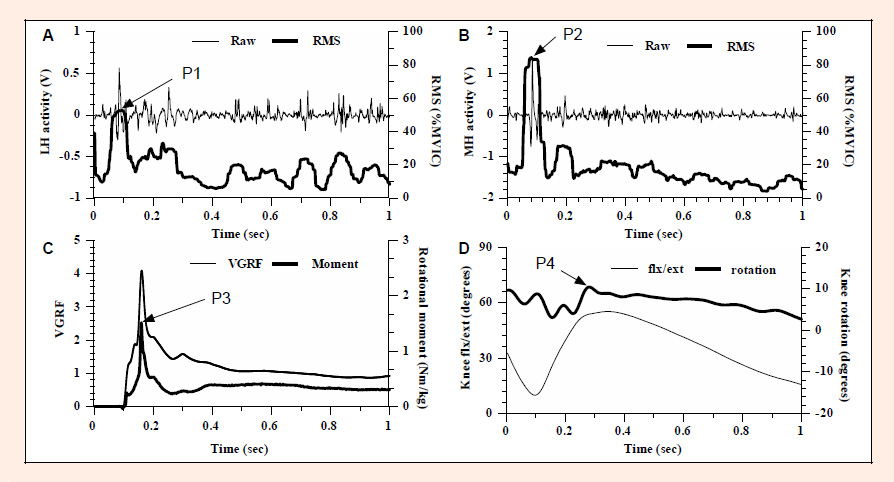
Figure 1.
Kinetic, kinematic, and EMG data from a representative subject during drop landing. Each graph demonstrates the parameters used for the analysis. (A) Lateral hamstring (LH) activity. The thick line indicates RMS values normalized to MVIC. The thin line indicates the raw EMG signals. P1 demonstrates the peak LH activity. (B) Medial hamstring (MH) activity. Again the thick line indicates normalized RMS values and the thin line indicates the raw signals. P2 demonstrates the peak MH activity. (C) Vertical ground reaction force (VGRF) and rotational moment around knee. P3 demonstrates peak rotational moment. (D) Knee joint angles. Positive values represent flexion (the thin line) and internal rotation (the thick line) angle of the knee. P4 demonstrates the peak internal rotation angle.