 |
Figure 5.
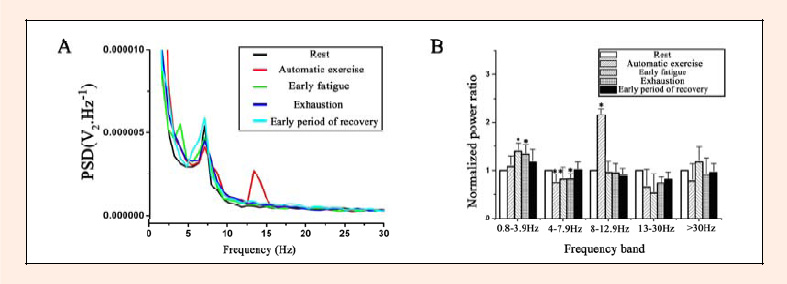
Changes of electrocorticogram in the sensorimotor cortex. A, Power spectral density of all conditions. B, Normalized spectral changes divided into frequency bands.p < 0.05, p < 0.01 rest condition.
|
|
|
Figure 5.
Changes of electrocorticogram in the sensorimotor cortex. A, Power spectral density of all conditions. B, Normalized spectral changes divided into frequency bands.p < 0.05, p < 0.01 rest condition.
|