 |
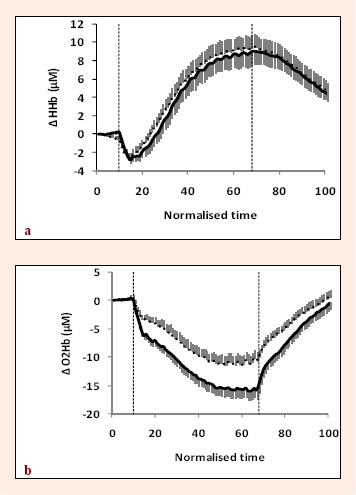
Figure 1.
∆ HHb profile; b. ∆ OHb profile; (mean and SE). Solid line indicates NVIB and dotted line VIB conditions. Vertical dashed lines indicate start and end of the exercise protocol.
|
|
|
Figure 1.
∆ HHb profile; b. ∆ OHb profile; (mean and SE). Solid line indicates NVIB and dotted line VIB conditions. Vertical dashed lines indicate start and end of the exercise protocol.
|