 |
Figure 3.
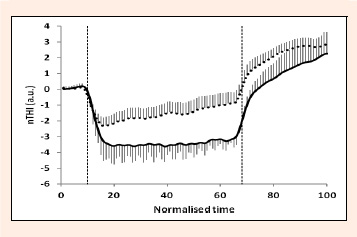
nTHI profiles (mean and SE). Solid line indicates NVIB and dotted line VIB conditions. Vertical dashed lines indicate start and end of the exercise protocol.
|
|
|
Figure 3.
nTHI profiles (mean and SE). Solid line indicates NVIB and dotted line VIB conditions. Vertical dashed lines indicate start and end of the exercise protocol.
|