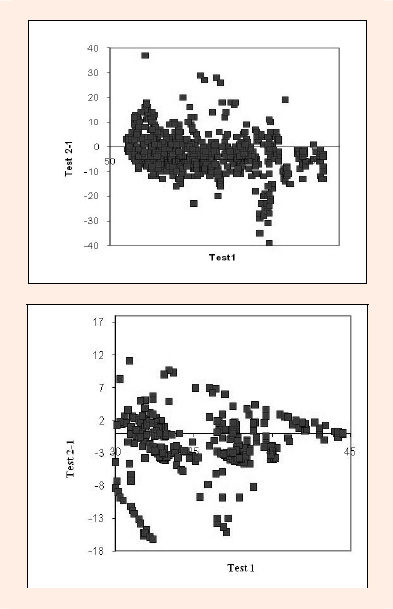
Figure 1.
Residual versus predicted plot demonstrating the data spread for (a) HR and (b) BF.