 |
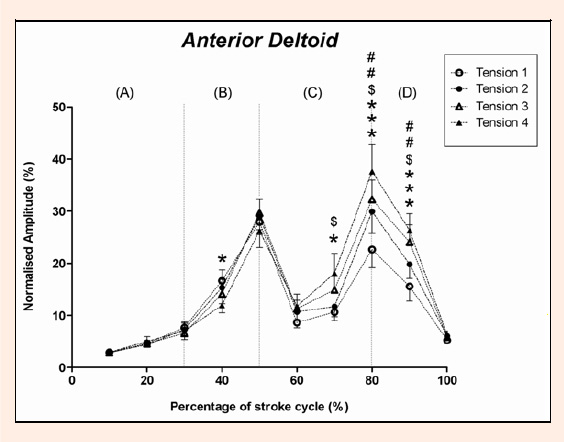
Figure 1.
Group mean ± SEM (n=10) normalised EMG amplitude for AD at each 10% interval of the kayak stroke cycle across all tension levels. Asterisk infer significant difference between T1 and T4 (* p < 0.05, *** p < 0.001). Hash infer significant difference between T1 and T3 (## p < 0.01). Dollar infer significant difference between T2 and T4 ($ p < 0.05). Approximate phases of the kayak stroke cycle are represented by A (draw), B (transition), C (opposite draw) and D (opposite transition).