 |
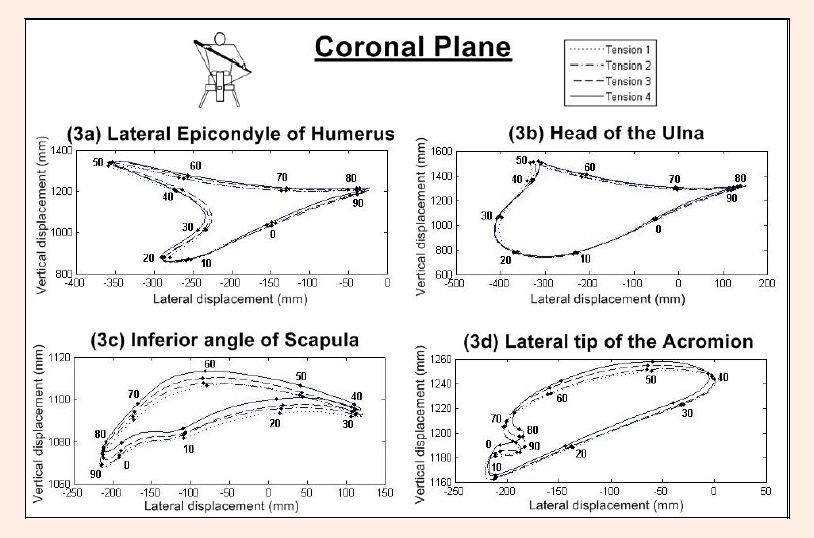
Figure 3.
Kinematic data for elbow (3a), wrist (3b), scapular (3c) and shoulder (3d) markers in the coronal plane. Data presented as group mean marker displacement (mm) at each 2% interval of stroke cycle, separate lines represent kinematic data for tensions investigated. The 10% timepoints in the stroke cycle are marked (black dot) and numbered on each trace. In addition, the spatial orientation of the kayaker is graphically depicted.