 |
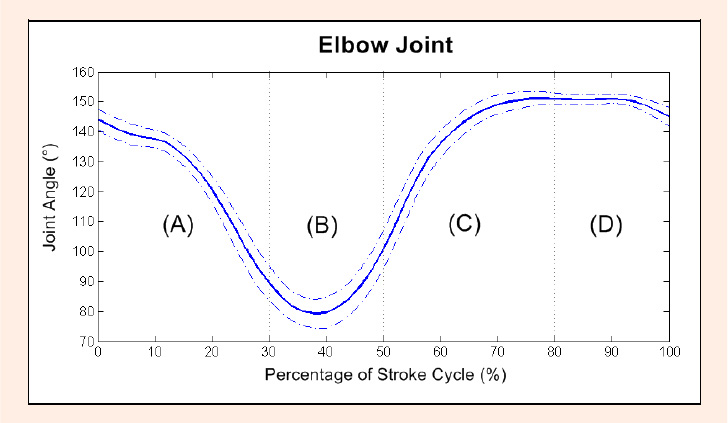
Figure 4.
Elbow joint angles during the on-ergometer kayak stroke cycle. Data presented as group mean ± SEM (Ëš) at each 2% interval of the stroke cycle during kayaking at tension level 1 (T1). The approximate phases of the stroke cycle are represented as A (draw), B (transition), C (opposite draw) and D (opposite transition).