 |
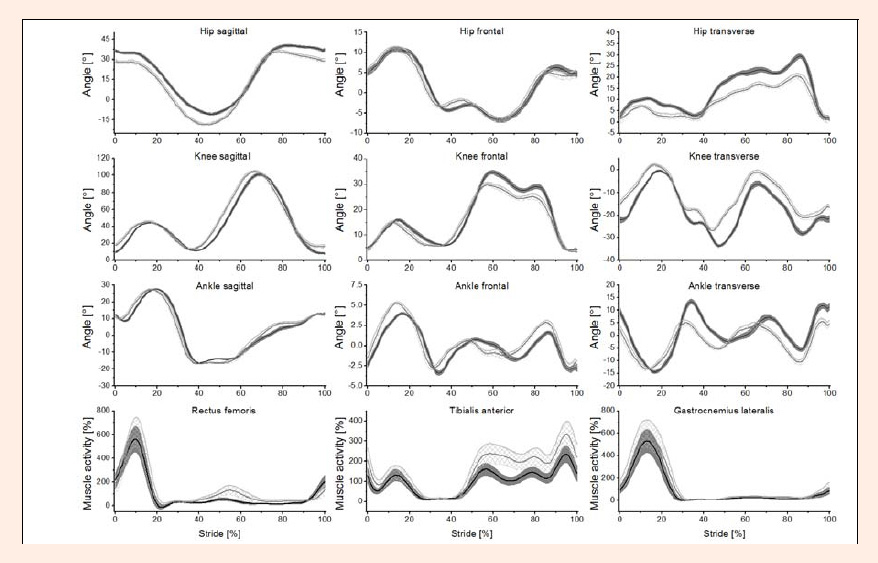
Figure 2.
Representative results of hip, knee and ankle joint trajectories and EMG of one runner, which reflect the overall trend of all runners. Depicted are the mean curves and the point-to-point standard deviation of all three planes and all three muscles. Solid black lines represent mean curves of NT running and the grey area represents the standard deviation. The grey solid lines represent the RT running condition and the dense grey area represents the standard deviation. The presented EMG values were normalized to the average EMG value during NT running. This average value was taken as 100 %-baseline and the normalized data are expressed as a percentage of this baseline value.