 |
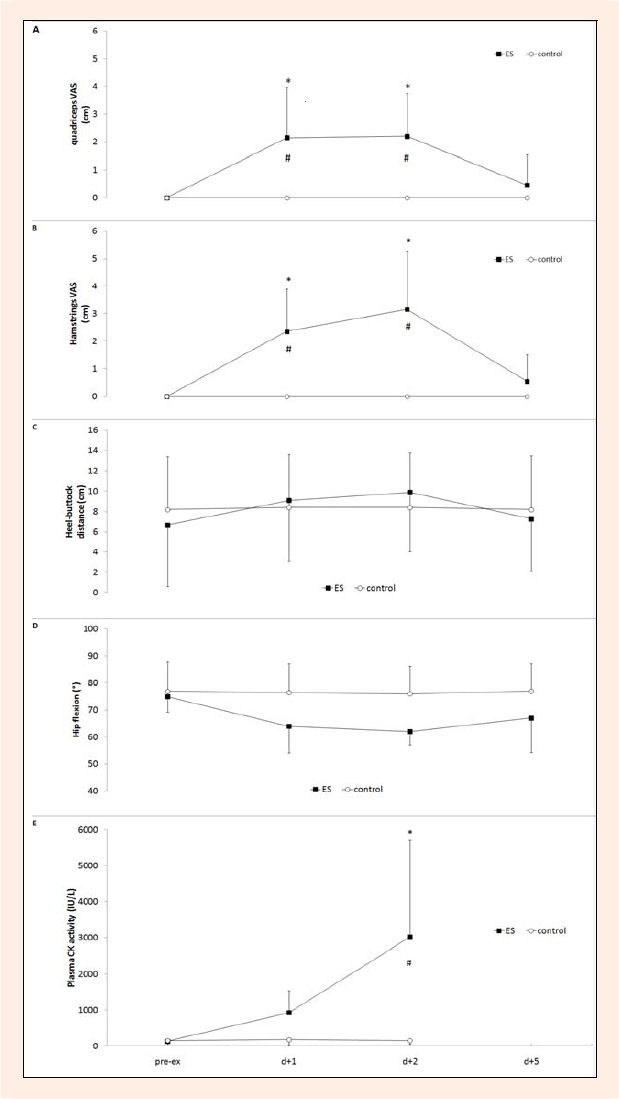
Figure 4.
Changes (mean and standard deviation) in perception of quadriceps soreness (VAS) (A), in perception of hamstrings soreness (VAS) (B), in quadriceps flexibility (C), in hamstrings flexibility (D) and in serum CK activity (E) in the electrostimulated group (ES, n = 10) and in the control group (control, n = 10) before the electrical stimulation exercise (pre-ex), one day (d+1), two days (d+2) and five days (d+5) after exercise. * = significantly (p ≤ 0.05) different from baseline value (pre-ex). # = significant (p ≤ 0.05) difference between ES and control.