 |
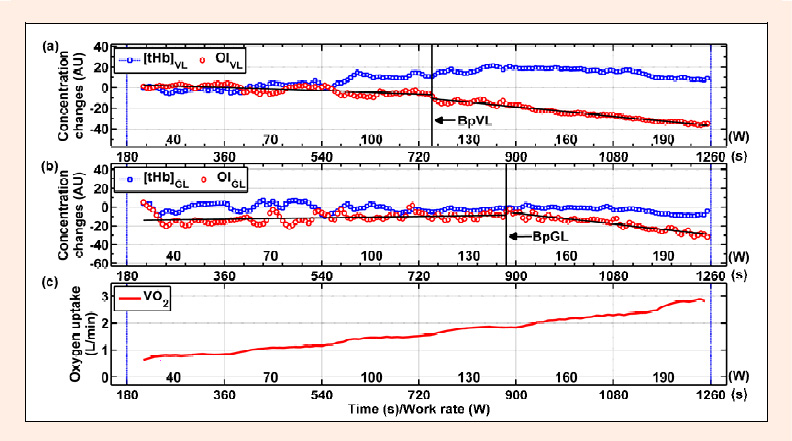
Figure 1.
A typical result from a female participant is presented. ∆[tHb], the change in total haemoglobin concentration; OI, the oxygenation index; VL, ; GL, ; AU, arbitrary unit; VO, oxygen uptake. The vertical blue dotted lines indicate the start and the end of the incremental cycling exercise; the vertical black solid lines in subgraph (a) and (b) indicate the breakpoints (Bp) of OI in the VL (BpVL) and GL (BpGL); significant changes in slope of OI decrease during exercise (BpVL and BpGL) were identified by calculating combinations of linear regressions [black solid lines shown in subgraph (a) and (b)] that yielded the lowest sum of squared residuals.