 |
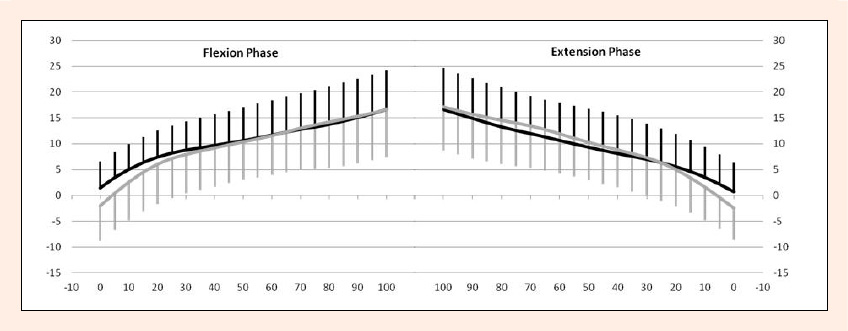
Figure 4.
Y-axis: tibial internal rotation (°). X-axis: knee flexion (°). Left graph: Flexion phase. Right graph: Extension phase. Thick line: ACLD knee. Thin line: Contralateral knee. There were no significant differences by repeated measures ANOVA. Error bars represent ± 1 standard deviation.