 |
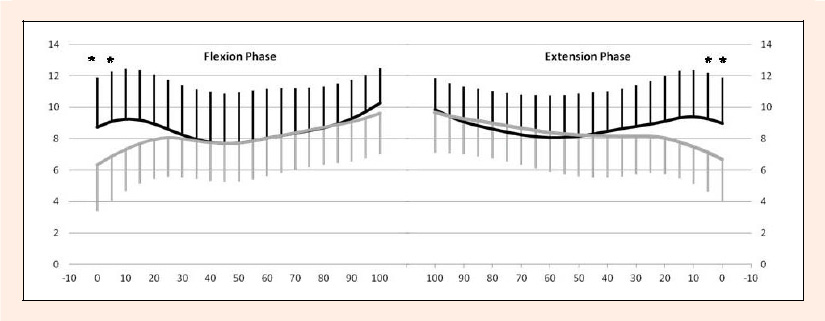
Figure 5.
Y-axis: tibial anterior translation (mm). X-axis: knee flexion (°). Left graph: Flexion phase. Right graph: Extension phase. Thick line: ACLD knee. Thin line: Contralateral knee. There were significant differences at 0 and 5° of knee flexion in both phases. Asterisk denotes p value < 0.05 by repeated measures ANOVA. Tukey’s test was used for post-hoc pair wise comparisons. Error bars represent ± 1 standard deviation.