 |
Figure 1.
Mean resting systolic blood pressure change in the experimental and control groups split into high (≥300mg) and low (<300mg) magnesium intake subgroups between baseline and week 2.
|
|
|
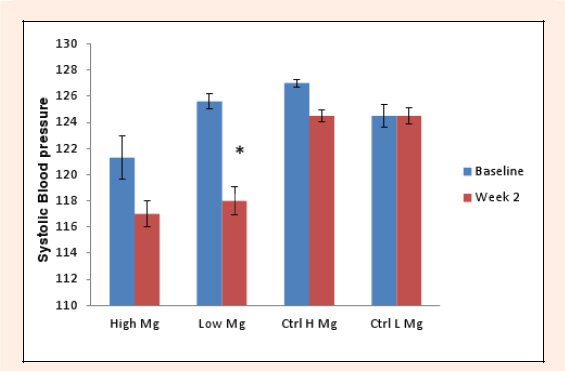
Figure 1.
Mean resting systolic blood pressure change in the experimental and control groups split into high (≥300mg) and low (<300mg) magnesium intake subgroups between baseline and week 2.
|