 |
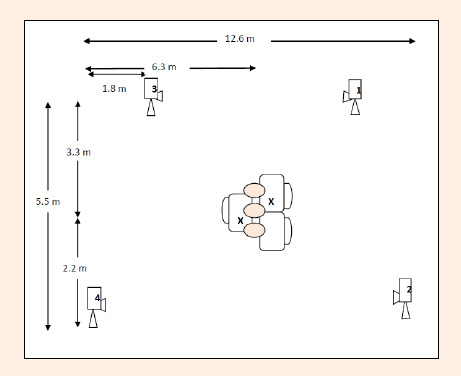
Figure 1.
Representation of the experimental testing area (1, 2, 3 and 4 represent video camera locations, X denotes the participant positions from which data was collected).
|
|
|
Figure 1.
Representation of the experimental testing area (1, 2, 3 and 4 represent video camera locations, X denotes the participant positions from which data was collected).
|