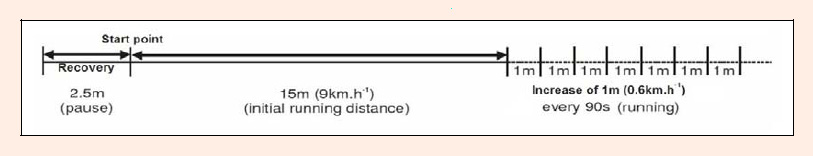
Figure 1.
Visual representation on the T-CAR test.