 |
Figure 2.
Analysis of Bland-Altman plot of PV obtained in T-VAM and T-CAR. The dashed lines indicates 95% limits of agreement.
|
|
|
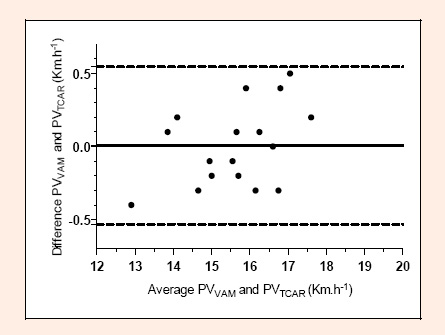
Figure 2.
Analysis of Bland-Altman plot of PV obtained in T-VAM and T-CAR. The dashed lines indicates 95% limits of agreement.
|