 |
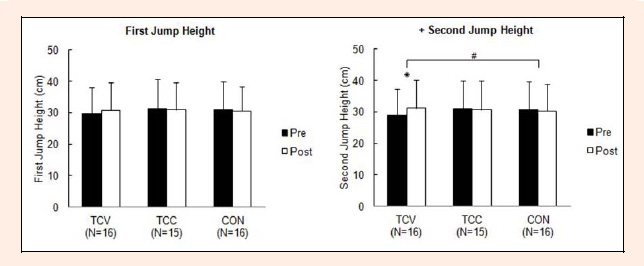
Figure 4.
# indicated that the posttraining value in the TCV group was significantly higher than the CON group after 8-weeks interventions. * indicated that significantly different between pre- and post- training values . + indicated that a significant interaction (group × time) effect (P < 0.05).