 |
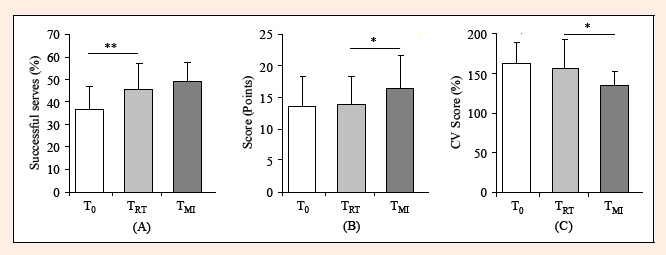
Figure 1.
Mean ± Standard Deviation for the accuracy outcomes during serve test before (T0), after regular training (TRT) and after Motor Imagery training (TMI). (A) The percentage of successful serves, (B) the accuracy score and (C) the coefficient of variation (CV) of the accuracy score, with * for p ≤ 0.05 and ** for ≤ 0.01.