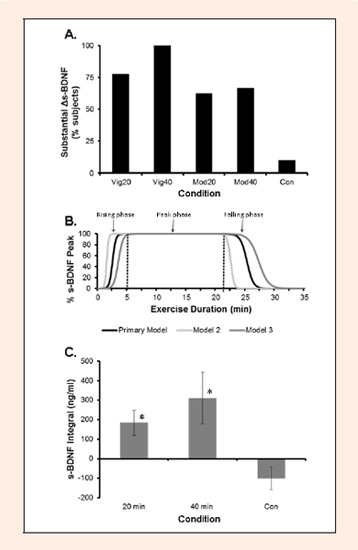
Figure 2.
Panel C shows mean ± SEM. * indicates significantly different from control (p < 0.05).