 |
Figure 1.
Relationships between average 200-m maximal performance (S200) and lactate minimum for male (left; = 29) and female (right; = 21) young swimmers. The continuous line represents the fitted regression line.
|
|
|
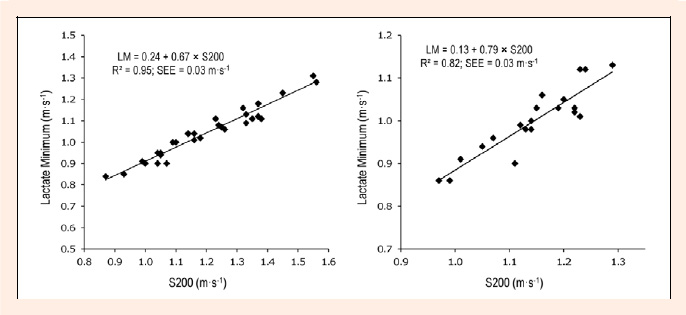
Figure 1.
Relationships between average 200-m maximal performance (S200) and lactate minimum for male (left; = 29) and female (right; = 21) young swimmers. The continuous line represents the fitted regression line.
|