 |
Figure 3.
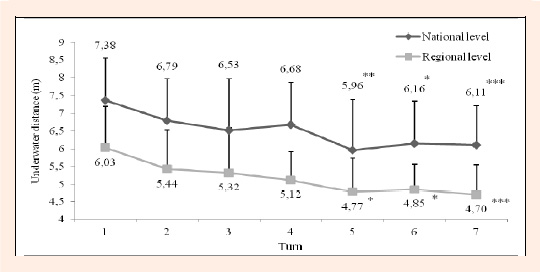
“Underwater distance” (m) evolution in the 200 m backstroke event for the national and regional level groups relative to the first turn. * p < 0.05; ** p < 0.01; *** p < 0.001.
|
|
|
Figure 3.
“Underwater distance” (m) evolution in the 200 m backstroke event for the national and regional level groups relative to the first turn. * p < 0.05; ** p < 0.01; *** p < 0.001.
|