 |
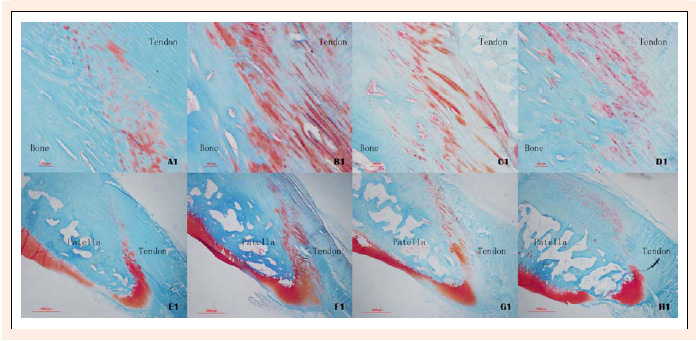
Figure 4.
The results of the Safranin O staining revealed that the proteoglycan profiles of the injury groups were altered when compared with the CON group. The proteoglycan profile of ND1W group was uneven, and the area of red staining decreased (A1, E1). The ND2W group showed an obviously uneven profile and an increase in the area of red staining (B1, F1). The red staining area of the ND4W group was still larger than that of the CON group, but the area and density were decreased compared with the ND2W group (C1, G1). The red staining area in the ND8W group was decreased compared with the ND4W group, and the profile was significantly uneven (D1, H1) (100× for A1, B1, C1, D1; 20× for E1, F1, G1, H1).