 |
Figure 1.
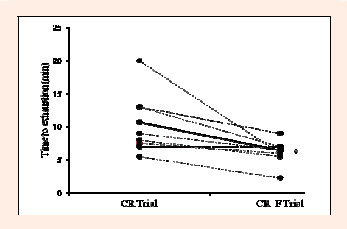
The changes in time to exhaustion of the intense running from CR trial to CR_F trial in all subjects ( = 9). Solid line indicates the average change. * Significantly different from the CR trial (p < 0.05)
|
|
|
Figure 1.
The changes in time to exhaustion of the intense running from CR trial to CR_F trial in all subjects ( = 9). Solid line indicates the average change. * Significantly different from the CR trial (p < 0.05)
|