 |
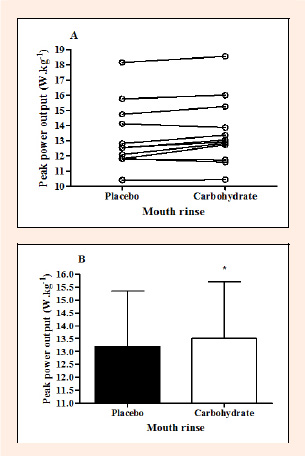
Figure 2.
Individual peak power output (W·kg; A) and mean (± SD) peak power output (B) for the placebo and carbohydrate trials. * significantly greater than the placebo trial (p < 0.05). ( = 12).
|
|
|
Figure 2.
Individual peak power output (W·kg; A) and mean (± SD) peak power output (B) for the placebo and carbohydrate trials. * significantly greater than the placebo trial (p < 0.05). ( = 12).
|