 |
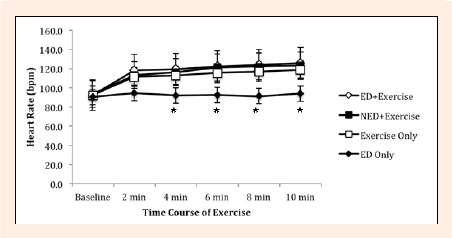
Figure 2.
Mean heart rate among participants in the exercise groups and in the no exercise group. An asterisk indicates significantly lower heart rate in the ED Only group compared to the exercise groups at p < 0.05. Error bars indicate SEM.