 |
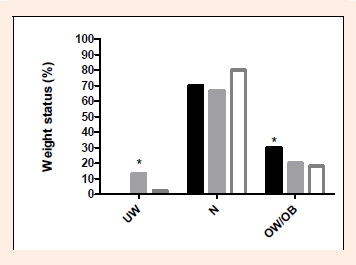
Figure 1.
Body mass status of Black (black bars), Indian (grey bars) and White (white bars) children. * denotes differences in the proportions of children between races (p < 0.05). Indian children had the most number of participants classified as underweight and Black children had the most number of participants classified as overweight.