 |
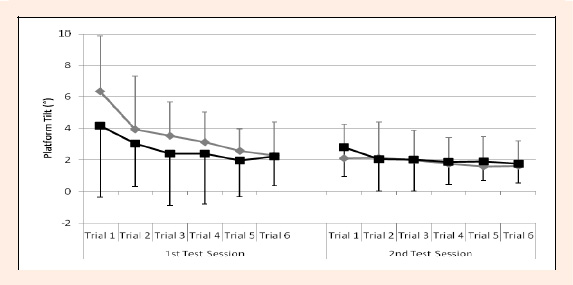
Figure 1.
Visual representation of the mean trial data. The dual limb Overall Stability Index (black line) and single limb stance overall stability index (grey line) are depicted but these trends are similar across all outcomes.
|
|
|
Figure 1.
Visual representation of the mean trial data. The dual limb Overall Stability Index (black line) and single limb stance overall stability index (grey line) are depicted but these trends are similar across all outcomes.
|