 |
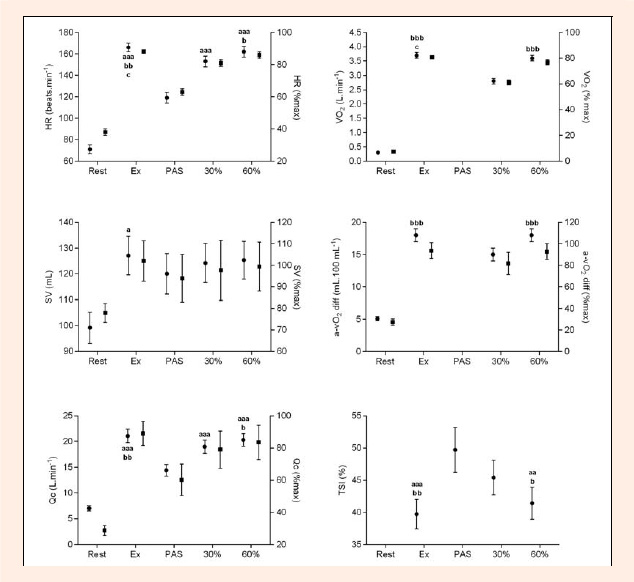
Figure 1.
Heart rate (HR), stroke volume (SV), cardiac output (Qc), oxygen consumption (VO), arteriovenous oxygen difference (a-vO diff), and tissue saturation index (TSI) measured simultaneously during the different intensities during the HIIT session: pre-exercise rest (Rest), 3-min work periods at 90% pVO (Ex), passive recovery (PAS), low-intensity recovery (30%), moderate-intensity recovery (60%). Data are presented as mean (n = 14; circles) and percentage of incremental test peak values (n = 5; squares) with 90% confidence intervals. VO values for Rest were calculated based on (5 mL·kg) (Medbø and Tabata, ) and were not available for PAS. TSI was not measured during rest or the max test. Letters ‘a’, ‘b’, and ‘c’ indicate a substantial difference versus PAS, 30%, and 60% respectively, with the number of letters representing a small (1 letter), moderate (2 letters), and large (3 letters) standardized differences respectively. If the 90% CL of the standardized differences overlapped small positive and negative values, the magnitude was deemed unclear; otherwise that magnitude was deemed to be the observed magnitude (Hopkins et al., ). For clarity, letters have been omitted for differences between Rest and all other intensities as all were clear and large. Data as a percentage of incremental test peaks were provided to indicate the relative load and demonstrated similar trends to raw values, however, because data was only available for 5 cyclists, statistical comparisons were not performed.