 |
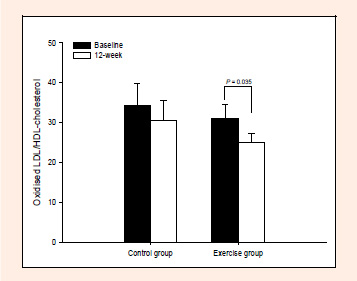
Figure 1.
The ratio of oxidised low-density lipoprotein (LDL) to high-density lipoprotein (HDL) cholesterol concentrations measured at baseline and 12 weeks in the control and walking groups. Data are means ± SEM. Main effect of time (p = 0.028) and time × group interaction (p = 0.592, 2-factor ANOVA). Significantly different from the baseline value in the same group (Paired Student’s t-tests, p = 0.035).