 |
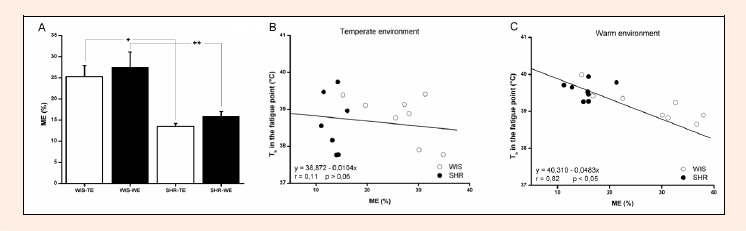
Figure 3.
Mechanical efficiency (ME, A) during moderate exercise and correlation between ME and Tb at the fatigue point in the temperate environment (B) and warm environment (C).Values are expressed as mean ± SEM, = 8 each group. + p < 0.05: SHR-TE vs. WIS-TE. ++ p < 0.05: SHR-WE vs. WIS-WE.