 |
Figure 1.
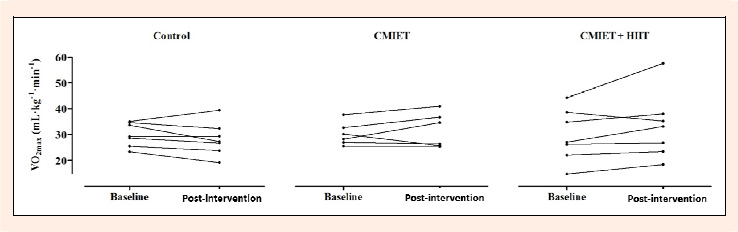
Individual changes in relative VO2max from baseline to post-intervention for control (left), CMIET (middle), and CMIET + HIIT (right) groups.
|
|
|
Figure 1.
Individual changes in relative VO2max from baseline to post-intervention for control (left), CMIET (middle), and CMIET + HIIT (right) groups.
|