 |
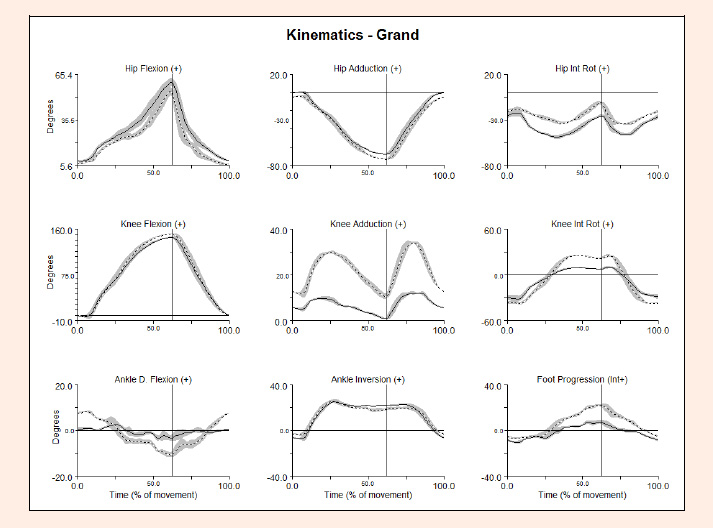
Figure 3.
Kinematic data (joint angles of hip, knee and ankle) demonstrating consistent differences between sides for grand plié. Note: Right side: dotted line (contralateral), Left side: solid line (symptomatic); shaded area indicates mean +/- 2SD; + indicates positive values on y-axis for given movement (for example, knee flexion is zero degrees into a positive direction, knee extension from zero into negative); the vertical line indicates timing at the deepest point of the grand plié.