 |
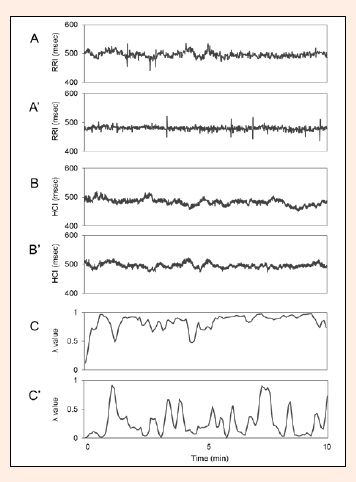
Figure 2.
Representative time series variation of cardiac rhythm, locomotor rhythm, and λ value in one subject. Shown are the time series of R-R interval (RRI) (A, A’), heel contact interval (HCI) (B, B’) and the trace of the λ value (C, C’) during CLS protocol (A, B, C) and free protocol (A’, B’, C’).